Monitoring is a crucial aspect of modern software development. It’s essential to have visibility into your system state at any given moment. The choice of what to monitor is flexible and really depends on your team, as monitoring tools can accommodate custom metrics. Common metrics to consider include memory usage, I/O, error rates, and more. In this article, I will guide you through setting up an open-source monitoring stack using Prometheus and Grafana for your Java Spring Boot application.
Sample Project
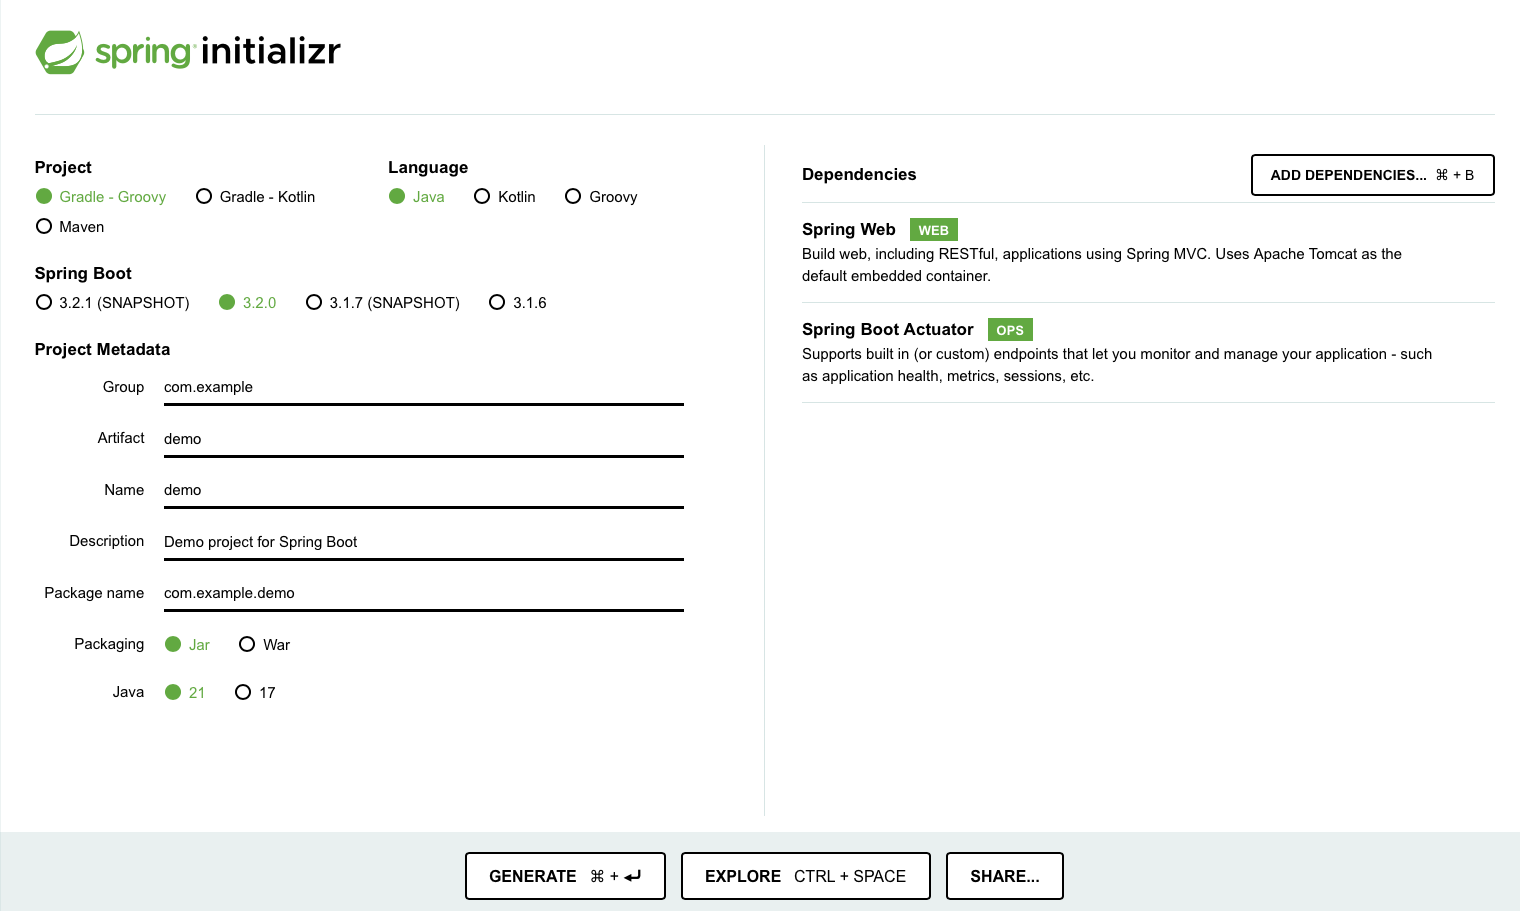
For our example I’m going to generate a new project using Spring Initializr with two dependencies:
- Spring Web - to expose some REST endpoint
- Spring Boot Actuator - to enable metrics endpoint

After generating the project, we need to add the Micrometer library to our build.gradle for exposing metrics in Prometheus format.
implementation 'io.micrometer:micrometer-registry-prometheus'
However, this library does not enable the metrics endpoint automatically. For that, we will need to edit our application.properties file and add the following line:
management.endpoints.web.exposure.include=prometheus
Prometheus metrics are now available at GET /actuator/prometheus.
I will also create a simple REST endpoint to be able to send some trafic to our app.
@RestController
public class Controller {

    @GetMapping("/ping")
    public String ping() {
        return "pong";
    }
}
Now we are ready to set up some monitoring for it.
The Outline
Common monitoring setup includes three components:
- Application itself (our Java app we created in the previous step)
- Prometheus server
- Grafana server
The role of each of these components is explained below.
Application
The application should expose a REST endpoint with a proper metrics format to be consumed by the Prometheus server.
Prometheus
The Prometheus server will poll the REST endpoint of the application to fetch metrics at a given point in time. Prometheus persists these metrics to preserve the timeline of application statuses. Prometheus exposes its own API for other consumers, such as Grafana in our case.
Grafana
Grafana consumes Prometheus API to display configured dashboards with data. Grafana does not store metrics; it only stores dashboard configurations.
Putting It All Together
In our example, we will use Docker to launch all of the components locally. To do this, we’ll need a Dockerfile for our application:
FROM amazoncorretto:21

COPY . /app
WORKDIR /app
RUN ./gradlew bootJar

ENTRYPOINT ["java", "-jar", "/app/build/libs/demo-0.0.1-SNAPSHOT.jar"]
Next, we will create a docker-compose.yml file to be able to launch all our services together (Java App, Prometheus, and Grafana).
version: '3'

services:
  app:
    build: .
    ports:
      - "8080:8080"

  prometheus:
    image: bitnami/prometheus:latest
    ports:
      - "9090:9090"
    volumes:
      - ./prometheus.yml:/etc/prometheus/prometheus.yml
      - ./prometheus-data:/prometheus

  grafana:
    image: grafana/grafana:10.2.2
    ports:
      - "3000:3000"
    volumes:
      - ./grafana-storage:/var/lib/grafana
Prometheus server requires a configuration file (prometheus.yml in our example) for defining where it should take metrics:
scrape_configs:
  - job_name: app
    metrics_path: /actuator/prometheus
    static_configs:
      - targets: ["app:8080"]
In this case, we specify metrics_path to our custom endpoint and set the target to the name of our Docker Compose service app.
Launching
Let’s run our services using docker-compose up -d and inspect them.
Our metrics are visible on the localhost:8080/actuator/prometheus endpoint.
If we visit the Prometheus UI on localhost:9090, we can query for some of them.
Finally, we need to setup a Grafana dashboard. Our local deployment assumes that Grafana is available at localhost:3000. After logging in with default creadentials (login admin and password admin), we can set our new admin password in the prompt. Initially, Grafana will not have any dashboards set up, so we need to configure a custom one for our needs. Thankfully, there are plenty of preconfigured dashboards that can parse Prometheus metrics exposed by Micrometer:
- Spring Boot 2.1 System Monitor, dashboard ID
11378 - JVM (Micrometer), dashboard ID
4701
For our example, we will use JVM (Micrometer) dashboard.
Setting up a Data Source in Grafana
Each Grafana dashboard needs a data source to fetch data from. That’s why we first need to configure our Prometheus data source:
- Go to ‘Add your first data source’
- Select Prometheus
- Set the Prometheus server URL to
http://prometheus:9090(the domain nameprometheusis created automatically in the docker network) - Save the data source
Configuring Grafana Dashboard
With the data source ready, we can now configure a dashboard to use it:
- Go to ‘Create your first dashboard’
- Select ‘Import a dashboard’
- Use dashboard ID
4701for JVM (Micrometer) dashboard and click ‘Load’ - Select Prometheus as data source
- Click ‘Import’ to save your dashboard
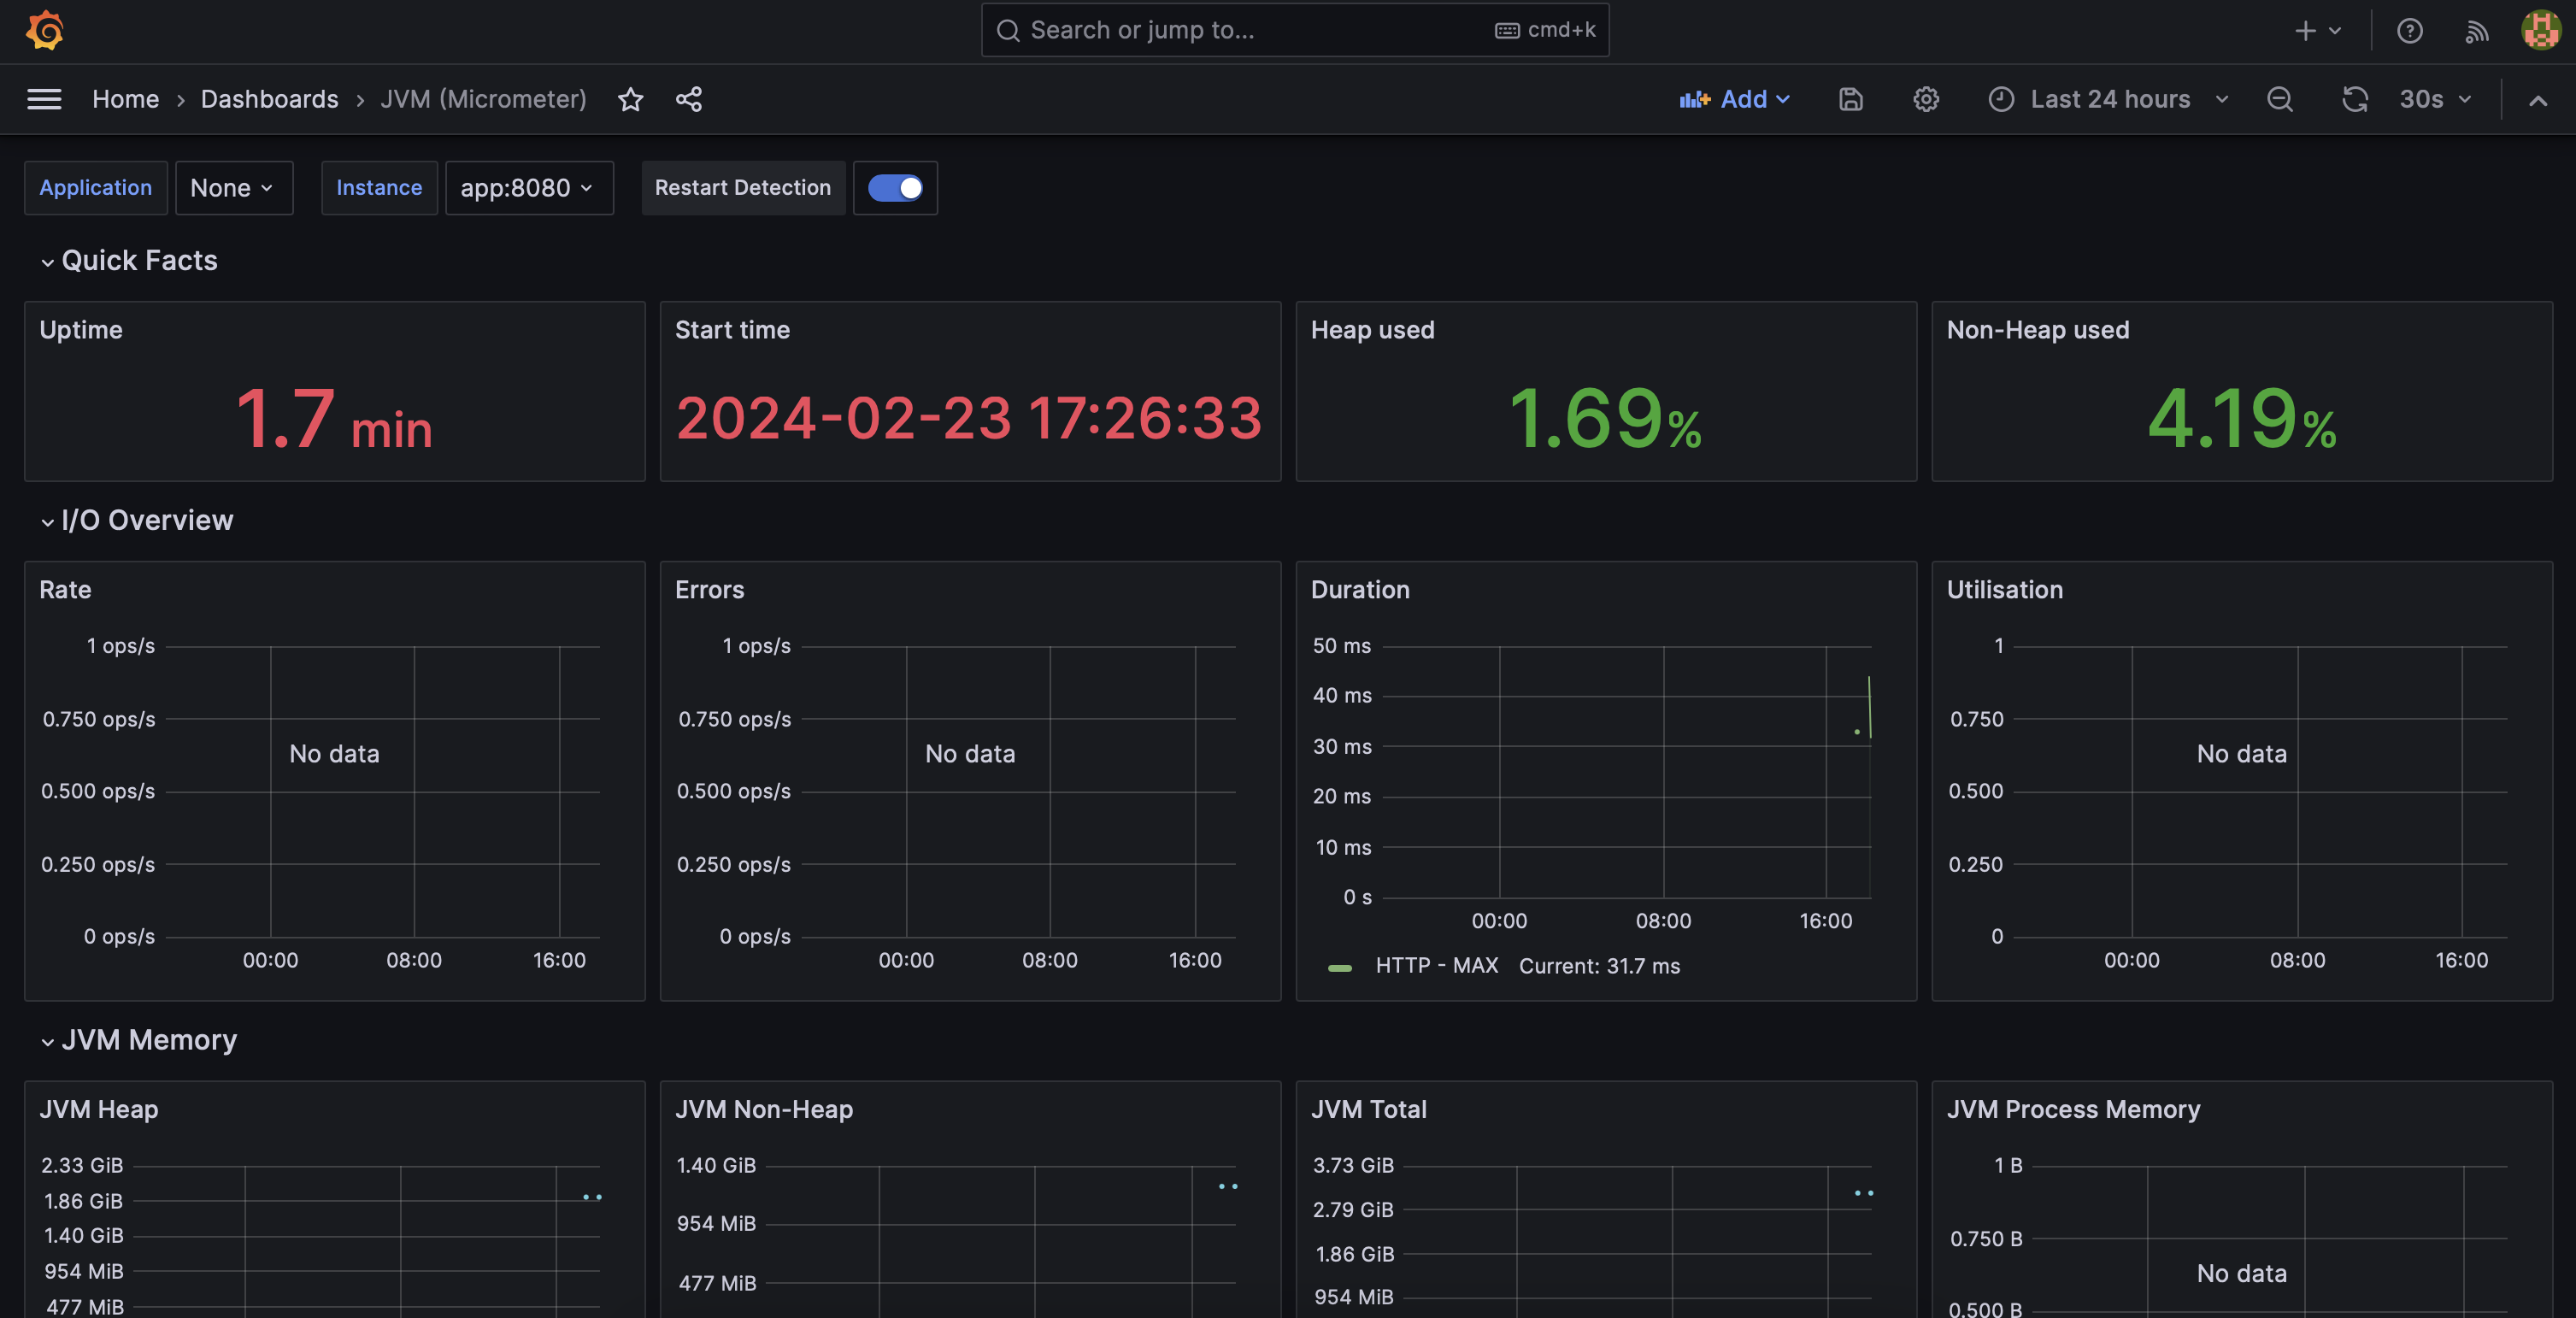
Now you can see your nice JVM monitoring dashboard. If you just launched your application, it might look a bit empty, such as in the screenshot below. But the data will start to populate with time, and the dashboard will look richer.

What’s Next
Now you have a solid foundation to customize your monitoring toolset by adding custom Prometheus properties and modifying Grafana dashboards.
Your production setup, however, is going to be more sophisticated than a single docker-compose.yml file for all services due to the need of proper availability. The current setup is more of an example, capable of being deployed locally for experiments.
Also, please consider using Prometheus Alertmanager for setting up alerts based on custom conditions. At the end of the day, we are setting up monitoring to be informed about any system problems.